It comes to the final stage of the trading system - setting a target risk for the portfolio and deciding an appropriate position size. Over-leveraged may blow up an account in one day, while the power of compounding will not be utilized efficiently with an under-leveraged position. Then, I will test the whole system and evaluate the performance using different methods.
Step 3. Volatility targeting and position sizing
Volatility targeting
Under the Gaussian distribution, the optimal sizing suggested by Kelly criterion is exactly the same level as the Sharpe ratio. With the 0.7-0.8 Sharpe, the optimal risk level is ~75%. However, there are some obvious flaws with this optimal level.
Performance table obtained from the newest data
GLD | TLT | VTI | |
Return | 1.049292 | 0.415363 | 0.641128 |
|---|---|---|---|
Volatility | 1.216389 | 0.484122 | 0.916848 |
Sharpe | 0.862629 | 0.857971 | 0.699274 |
Skew | 0.275193 | -0.296233 | 0.026088 |
Lower-tail | 1.710427 | 1.484037 | 1.974310 |
Upper-tail | 1.498932 | 1.726892 | 1.540739 |
Returns are not perfect Gaussian distribution. Firstly, the returns are highly skewed ranging from -0.29 to +0.27. Secondly, the fat tails are shown by the 1.5-2.0 tail ratios. Both are evidence that our system does not follow the normal distribution.
The Sharpe ratio is just an estimation. We could never know the TRUE Sharpe ratio of the system. The market is always changing. Our system will or will not work sometimes. In fact, if we look at the rolling Sharpe ratio, it is a wiggly curve.
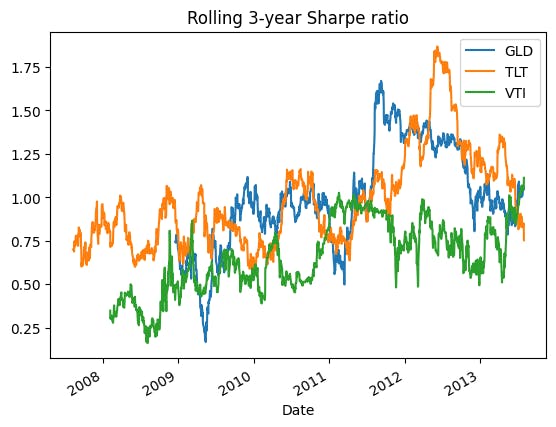
Therefore, many traders use the fraction Kelly. To be more conservative, I will use a one-fourth Kelly here, giving me a 25% (=0.75/3) risk target. To calculate the position given a target risk, we just downsize the position by the ratio between the target volatility and current volatility.
$$\tau=Volatility_{target}$$
$$Position_{target} = Position\times \frac{\tau}{\sigma}$$
For example, the volatility of VTI is ~100%, we just downsize it to one-fourth of the current position. However, this volatility is solely obtained from the back-test. Using this to indicate our position may overfit the data. Hence, I will use the volatility scaling method instead.
Volatility scaling
Think about the formula of our P/L. It's just the number of contracts times the price variation. Our position size is a function of our target risk and our forecast, so we can have the following equation:
$$P/L=Position(Forecast,\tau)\times PriceVariation$$
What is the definition of volatility? The average price variation! Thus, P/L equals the position times volatility on average.
$$P/L=Position(Forecast,\tau)\times \sigma$$
If we can offset the volatility, the P/L will only depend on our forecast and target risk!
$$P/L=(Position(Forecast,\tau)\times\frac{1}{\sigma})\times \sigma$$
$$\rightarrow P/L=Position(Forecast,\tau)$$
We can do this by dividing our position by the expected volatility.
$$Position = \frac{Forecast}{10}\times\tau\times\frac{1}{\sigma_{expected}}$$
For more details, please watch AHL Explains - Volatility Scaling by Man AHL.
Volatility forecasting
Volatility clusters in the short term, while mean-reverts in the long term. It means that (1) the volatility of this month is likely to be the same as the last month and (2) the volatility tends to move to the average of the last several years. Technically, the VIX is not the true volatility but it also demonstrates those characteristics.
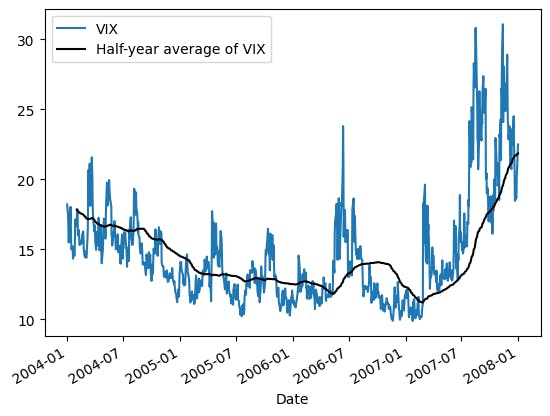
Therefore, I will use the weighted average of the short-term volatility and the longer-term volatility to forecast future volatility.
$$\sigma_{expected}=0.7\times\sigma_{1-month}+0.3\times\sigma_{6-months}$$
$$VolatilityScalar=\frac{1}{\sigma_{expected}}$$
def volatilityScaling(prices,short=21,long=126,days=252):
  rets = logReturns(prices)
  short_vol = rets.rolling(short).std()*(days**0.5)
  long_vol = rets.rolling(long).std()*(days**0.5)
  exp_vol = 0.7*short_vol+0.3*long_vol

  output = 1/exp_vol
  return output

target_volatility = 0.25
volatility_scalar = volatilityScaling(prices)
position = combine_forecasts.shift(1)/10*target_volatility*volatility_scalar.shift(1)
| GLD | TLT | VTI | |
| Return | 0.171026 | 0.084260 | 0.101436 |
| Volatility | 0.166078 | 0.113806 | 0.169696 |
| Sharpe | 1.029791 | 0.740385 | 0.597748 |
| Skew | 0.483025 | -0.608608 | -0.836701 |
| Lower-tail | 1.857195 | 1.953422 | 2.224911 |
| Upper-tail | 1.462337 | 2.043992 | 1.563326 |
Data shows our success in reducing the risk. The volatility effectively decreased from (1.22, 0.48, 0.92) to (0.17, 0.11, 0.17). In addition, the return of GLD is improved, but both TLT and VTI are worsened. As aforementioned, the return largely depends on our forecasts when we offset the effect of volatility. So if our forecasts are bad, it will yield bad results.
We reduced the risk, but less risk also implies less return! The risk shown above is even lower than our target risk. That is due to the diversification in sub-systems (3 strategies and countless variations). We can multiply our position by a forecasts-diversification-multiplier to obtain our target risk. Here, I arbitrarily set it to 1.5.
forecasts_diversification_multiplier = 1.5
Instrument weights
For the instrument weights, I will follow the benchmark portfolio. Again, there will be a diversification effect on instruments, so I also multiply the position by an instruments-diversification-multiplier of 1.5.
Original weight (%) | Rescaled weight (%) | Ticker |
30.00 | 38.71 | VTI |
40.00 | 51.61 | TLT |
7.50 | 9.68 | GLD |
target_volatility = 0.25
volatility_scalar = volatilityScaling(prices)

forecasts_diversification_multiplier = 1.5
instruments_diversification_multiplier = 1.5
diversification_multiplier = forecasts_diversification_multiplier*instruments_diversification_multiplier

position = combine_forecasts.shift(1)/10*target_volatility*volatility_scalar.shift(1)*diversification_multiplier

returns = logReturns(prices)*position
returns['PORT'] = np.average(returns[symbols], weights=weights, axis=1)
| PORT | BCHM | GLD | TLT | VTI | |
| Return | 0.201771 | 0.069159 | 0.384808 | 0.189586 | 0.228230 |
| Volatility | 0.193334 | 0.088937 | 0.373676 | 0.256064 | 0.381817 |
| Sharpe | 1.043635 | 0.777610 | 1.029791 | 0.740385 | 0.597748 |
| Skew | -0.315580 | -1.045088 | 0.483025 | -0.608608 | -0.836701 |
| Lower-tail | 1.751857 | 1.459271 | 1.857195 | 1.953422 | 2.224911 |
| Upper-tail | 1.607397 | 1.380125 | 1.462337 | 2.043992 | 1.563326 |
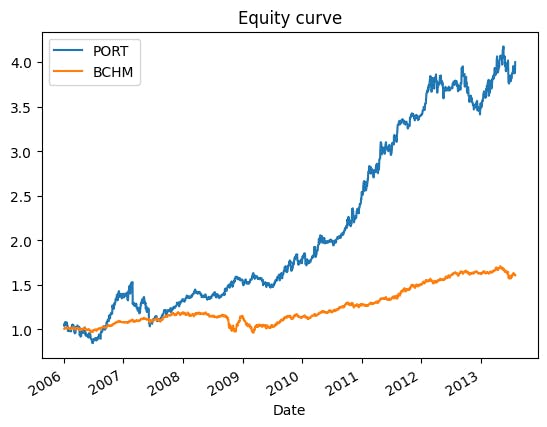
The portfolio effectively yields a better Sharpe ratio than the benchmark. It is a 0.26 improvement from 0.78 to 1.04. It also takes an appropriate risk to accelerate the return. We can see the equity curve below. The portfolio's value is four times its initial while the benchmark has not even doubled. Skewness is much lower (-0.32) than the benchmark (-1.05) too. However, the tail ratios are significantly higher by ~0.3, implying a higher probability of extreme returns.
Out-of-sample test
All the tests we've done are using the training set data (2006-2014). We've applied various techniques to optimize the system. The result shown above is much better than the benchmark but what's the performance later on? Is it a really better system or we've just overfitted the data?
Separate data set
Let's look at the performance of the testing set data (2014-2023) first.
test_returns = returns.loc[test_index,:]

performance = pd.DataFrame([test_returns.apply(annualizedReturn),
                            test_returns.apply(annualizedVolatility),
                            test_returns.apply(sharpeRatio),
                            test_returns.apply(periodSkew),
                            test_returns.apply(lowerTailRatio),
                            test_returns.apply(upperTailRatio)])
| PORT | BCHM | GLD | TLT | VTI | |
| Return | 0.113652 | 0.053390 | -0.025446 | 0.153015 | 0.095956 |
| Volatility | 0.170869 | 0.093626 | 0.289687 | 0.203451 | 0.347654 |
| Sharpe | 0.665144 | 0.570250 | -0.087840 | 0.752097 | 0.276011 |
| Skew | -0.394803 | -0.532049 | 0.882867 | -0.281116 | -0.369519 |
| Lower-tail | 1.797940 | 1.382292 | 2.236726 | 1.722985 | 2.386538 |
| Upper-tail | 1.391596 | 1.294583 | 1.957446 | 1.763331 | 1.705770 |
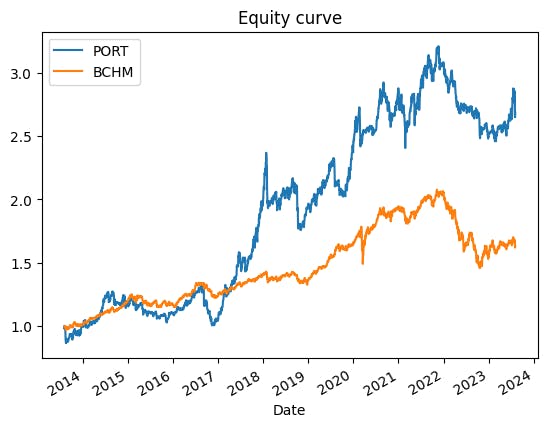
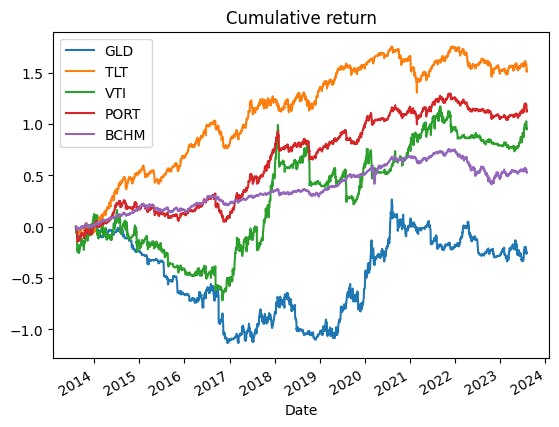
The system did show a slight edge against the benchmark in both Sharpe (0.67 vs 0.57) and skewness (-0.39 vs -0.53). However, it's only literally a slight edge, while the lower-tail is much worse (1.80 vs 1.38). The source of the setback may be GLD and VTI. We can see that the Sharpe ratio dropped significantly in these assets. GLD crashed from +1.03 to -0.09. VTI experienced a smaller but still steep decline from +0.6 to +0.28. Both are the assets we've applied the trend following system and this may be the reason. The plot below also shows that the system on VTI and GLD is underperforming during 2014-2017. We wouldn't know until we drill into the data.
Random sampling
Another method to evaluate the result is random sampling. We can draw the return from the historical data randomly and do this multiple times. Then, we can average the results and evaluate their average performance.
index_pool = returns.dropna().index
# 10% of data each set
size = len(index_pool)//10
# 10 subsets
subsets = 10

# Draw 10 non-replacing index from the pool
drawn_indexes = np.random.choice(index_pool,size=(subsets,size),replace=False)

all_performances = list()
for index in drawn_indexes:
  sample_returns = returns.loc[index]
  performance = pd.DataFrame([sample_returns.apply(annualizedReturn),
                              sample_returns.apply(annualizedVolatility),
                              sample_returns.apply(sharpeRatio),
                              sample_returns.apply(periodSkew),
                              sample_returns.apply(lowerTailRatio),
                              sample_returns.apply(upperTailRatio)])
  performance.index = ['Return',
                       'Volatility',
                       'Sharpe',
                       'Skew',
                       'Lower-tail',
                       'Upper-tail']
  all_performances.append(performance)

combine_performances = pd.concat(all_performances,axis=1).groupby(level=0,axis=1).mean()
Here, I randomly select 10 subsets of data. Each set consists of 10% of data (434 data points ~ 1.75 years). Then, I compute the performance metrics for each subset and average the metrics at the end.
| PORT | BCHM | GLD | TLT | VTI | |
| Return | 0.152504 | 0.059425 | 0.145213 | 0.147435 | 0.161086 |
| Volatility | 0.180401 | 0.092726 | 0.327514 | 0.221904 | 0.361624 |
| Sharpe | 0.868385 | 0.657029 | 0.438129 | 0.671338 | 0.459709 |
| Skew | -0.374959 | 0.092433 | -0.191816 | -0.261604 | -0.178632 |
| Lower-tail | 1.774814 | 1.413716 | 2.038163 | 1.880235 | 2.319813 |
| Upper-tail | 1.522835 | 1.294057 | 1.668555 | 1.895974 | 1.689442 |
The system clearly outperforms the benchmark in the Sharpe ratio (0.86 vs 0.65), although much lower than the expectation of 1.04. But both the skewness and tail ratios are underperforming. The average performance of a single random sampling test may not seem convincing. What if the sampling process is flawed? I've done 100 sampling tests, the following graph shows the distributions of the performance metrics.
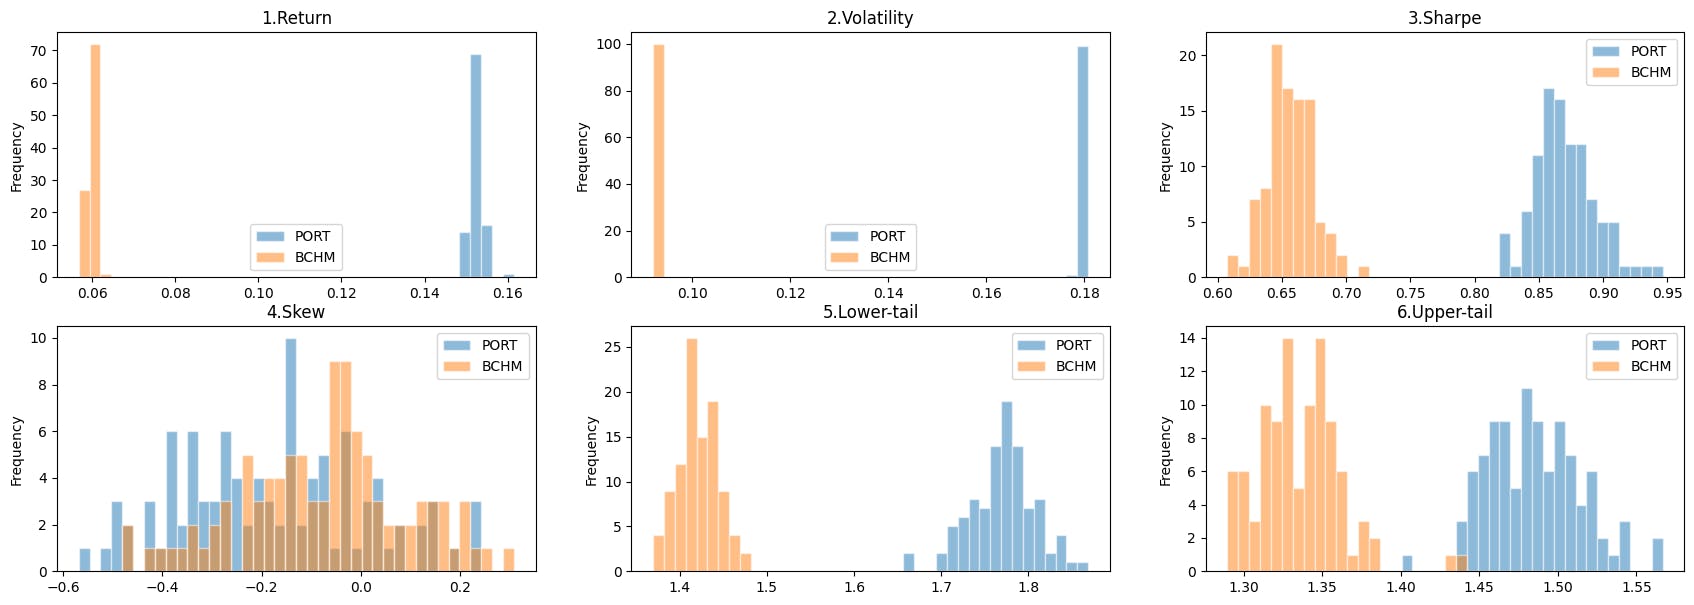
It is significant that our system has a better risk-adjusted return (Sharpe ratio) than the benchmark portfolio. The skewness is slightly underperformed but this is not supported by strong evidence as a large part of the skewness's distribution is overlapped. Yet the tail ratios of the system are apparently higher than the benchmark.
Conclusion
The constructed trading system both outperformed the benchmark in the out-of-sample test and random sample test. We can conclude that our actively-managed system has a better risk-adjusted return than just buy-and-hold the benchmark portfolio. However, we may need to be aware of the negative skew and fatter tail generated by the system.
Further improvement
Accounting for costs: We ignored the trading costs: bid/ask spread, commissions, slippage, financing costs, etc. This may be a serious drawback to the actual performance. Especially with a daily adjusting system.
Walk-forward testing: Despite the tests we've done, we tested the system on only HISTORICAL data. The market is rapidly evolving. Whether the system works in the future? We don't know yet.
Alpha models: The strategies we used are already known by many traders. Does it generate any alpha or edge? Or are we just earning profits by risk premiums? Taking appropriate risks is not a bad thing but a systematic edge is always the key to success!
